RSS
 

Posts Tagged ‘interactive’

Kill Math makes math more meaningful

05 Oct

Kill Math

After a certain point in math education, like some time during high school, the relevance of the concepts to the everyday and the real world seem to fade. However, in many ways, math lets you describe real life better than you can with just words. Designer Bret Victor hopes to make the abstract and conceptual to real and concrete with Kill Math.

Kill Math is my umbrella project for techniques that enable people to model and solve meaningful problems of quantity using concrete representations and intuition-guided exploration. In the long term, I hope to develop a widely-usable, insight-generating alternative to symbolic math.

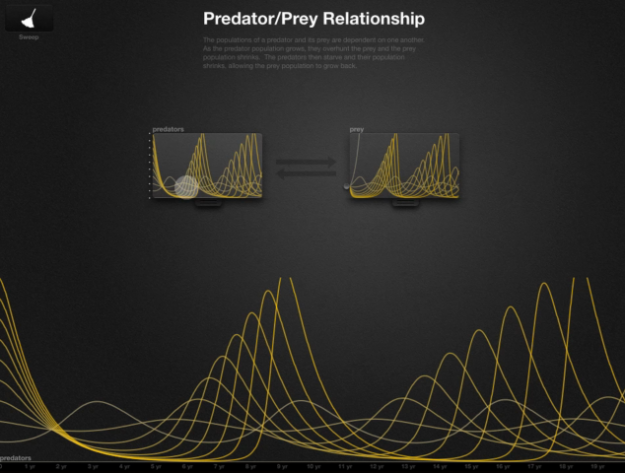
As part of the early project, Victor developed a prototype interface on the iPad to help you understand dynamical systems. It probably sounds boring to you, but the video and explanation will change your mind:

Statistics has the same problem with concepts, and is one of the main reasons why people hate it so much. They learn about curves, hypothesis tests, and distribution tables, and the takeaway is that there are some equations that you plug numbers into. Sad. Of course there are plenty of people working on that, but there's still a ways to go.

[Kill Math | Thanks, Matthew]


How do Americans spend their days?

20 Sep

How Americans spend their day -full

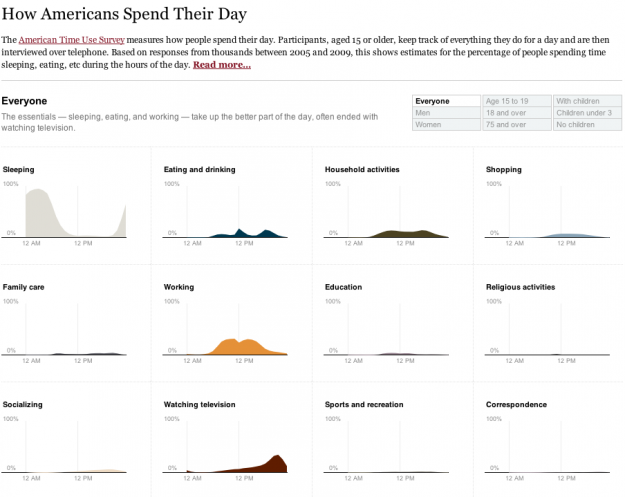
One of my favorite data graphics is an interactive piece by The New York Times that shows how Americans spend their day, based on the American Time Use Survey (ATUS). I've also been wanting to play with Mike Bostock's Data-Driven Documents, or D3 for short, for a while now. So put the two together, and this is what I got.

Main takeaway: we spend most of our time sleeping, eating, working, and watching television.

I followed the NYT aesthetic mostly for myself. I've found that a good way to learn is to try to copy something you like, and then use what you learn to do your own thing.

The NYT version was a stacked area chart with a number of interactions that made the data easier to read. I took a different route and split up some of the main activities, such as sleeping, eating, and working, into separate time series charts to see if it allowed you to see anything new. Showing separate charts at once places more focus on comparisons than on the distributions.

There was one challenge with the data that I didn't anticipate. ATUS provides a table of percentages by hour, but you'll notice with the NYT graphic the numbers are per ten minutes. You can actually calculate this with the ATUS microdata, which is basically the raw survey data from a few thousand respondents. I did this at first but lost patience, because I really just wanted to play with D3 rather than spend all my time building estimates.

I went with the hourly data which are averages for the sample population. The demographic breakdowns were only available in PDF, so I had some data entry fun, too. Luckily, I got my hands on Able2Extract (going off of Matthew Ericson's advice) to ease some of the pain.

Once the graphic was done, I noticed that the transitions are actually a nice way to show differences. For example, if you look at the time use for men and then women, the differences are subtle, but because the change is animated it's easier to spot. I think I knew this already, but probably never thought about it very deeply.

Anyways, it was fun playing around with D3. The beginning learning curve was kind of steep for me, but now that I know my way around a little better, I'm expecting more fun to come.

Mess around with the final graphic here. Let me know what you think.

[How Americans Spend Their Day]


The Sexperience 1000 shows a (statistical) view of what goes on in the bedroom

16 Aug

Age and virginity

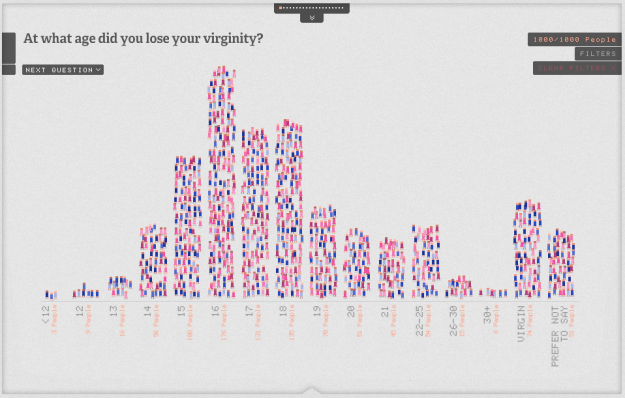
The bedroom is a private place, and what goes on in the bedroom usually stays in the bedroom. However, the Sexperience 1000 (by Mint Digital and Lingobee), using data from the "Great Britain Sex Survey," provides a statistical picture of what people do or have done.

The collection of small icons represents a sample of 1,000 people, and each icon represents an individual. They're color-coded by age and gender. Mouse over to see the age and the area they're from. From there, you can scroll through each question, such as, "At what age did you lose your virginity?" and the icons move around to their proper category.

Because the individual that each icon represents stays consistent throughout, you can loosely follow individuals as you flip through questions and categories. For example, people were asked what sexually transmitted diseases they've had. Select different diseases — Chlamydia, Gonorrhoea, etc — and there are a few people who seem to have been exposed to a lot of things.

Then there's the filters on the right that let you zoom in on the demographic you're interested in. Again, the icons sort themselves in a way that is useful.

One caveat: The sample of 1,000 people is supposed to be a demographic representative of the UK population, however, that sample itself is taken from another sample of 7,500 people who watch The Sex Education Show. So the answers to some of the questions are probably skewed. Plus, people often lie about sex. Still though, it's worth a look.

[The Sexperience 1000 | Thanks, Andy]


Why Census matters to you

04 Aug

Net person growth

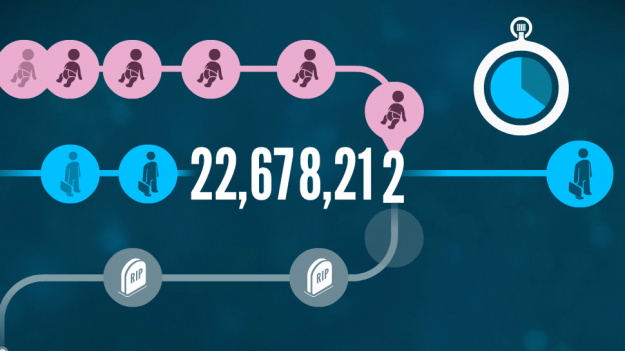
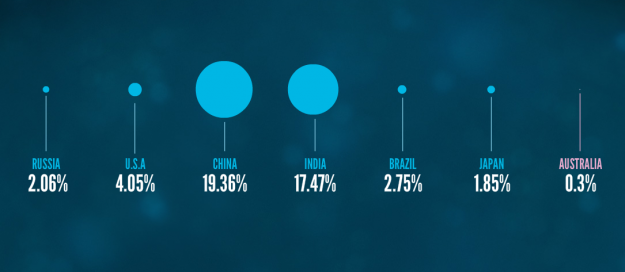
Census is any country is important in making major policy decisions and can affect your day-to-day, but it's not always obvious how. Leading up to the August 9 Australia Census, the Australian Bureau of Statistics put together an interactive called Spotlight, which helps its citizens understand the data a little better.

Spotlight takes some of the data from the last Census - conducted in 2006 - and turns it into a simple interactive movie, to show just a few of the interesting things that the Census can tell us about Australia's people and population.

As you go through the interactive, it asks you little bits about you such as gender and where you live, and then tells you information about what Census says about you and what's around. It also zooms out to put things in perspective.

The voice-over helps to make it extra playful. Even as a non-Australian, I found it pretty entertaining.

[Spotlight | Thanks, Tim]


All roads lead to philosophy, on Wikipedia

08 Jun

All Roads lead to Philosophy - xefer

Jeffrey Winter tests a hunch about links leading to philosophy on Wikipedia:

There was an idea floating around that continuously following the first link of any Wikipedia article will eventually lead to "Philosophy." This sounded like a reasonable assertion, one that makes a certain amount of sense in retrospect: any description of something will typically use more general terms. Following that idea will eventually lead… somewhere.

Winter's curiosity led to this simple mashup. Type in some terms in the search bar and see where those topics lead to. Lo and behold, they all reach philosophy somehow. The above was my own search for economy, poop, science, Forrest Gump, hamburger, and Chicago. Philosophy: the Kevin Bacon of Wikipedia.

[Xefer | Thanks, Nigel]


Complexity of time zones explained

30 Mar

Brief history of time zones

Do you understand how time zones work around the world and when exactly you need to move your watch forward or back? Me neither. BBC News provides a brief history of time zones via interactive globe.

Theoretically, the world should be divide into 24 equal time zones, in which each zone differs from the last by one hour. But as the years have passed, the world has turned into a much more complicated place. Time zones are now much more irregular and sometimes seem positively eccentric, affected as they are by political, geographical and social changes in the real world.

Rotate the globe to see where each time zone lands. Some of the zones seem relatively straight, but even in some areas like the GMT-2 time zone, there's some crookedness. There must be some small islands there or something. It's either that or the Royal Observatory is fond of puzzles. No, there aren't any other options.

[BBC News via @kelsosCorner]


Well-being of the nation mapped

07 Mar

Well-being of nation

Analyzing Facebook and Twitter updates to gauge happiness is all the rage these days, but Gallup has been doing it old school for the past three years. Every day, Gallup has called 1,000 randomly selected American adults and asked them a series of questions about their well-being such as, "Did you experience feelings of happiness during a lot of the day yesterday?" and "Do you smoke?"

Matthew Bloch and Bill Marsh for the New York Times mapped the responses for the past calendar year. Use the browser to quickly compare well-being in your area and across the country.

Above is the composite index of all the indicators. Looks like there's some good stuff going up north. Maybe not so much in the southeast.

The interactive is most interesting when you start comparing areas (especially near your own) and indicators. For example, here's the map for percentage who exercise:

Now with almost a complete flip, here's the map for smoking:

Find anything interesting? Let's hear it in the comments.

[New York Times via @rothzilla]


Watch the world get fatter over the past three decades

08 Feb

Weight of the world

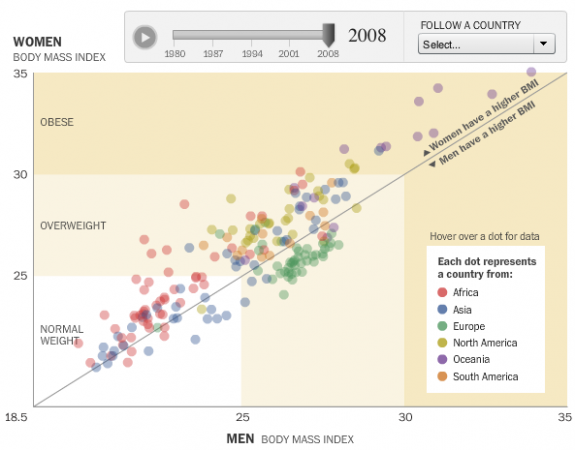
People are getting fatter everywhere. You know this. But there's nothing like the numbers to actually show how we're growing outwards and by how much. With this interactive, Wilson Andrews and Todd Lindeman, for the Washington Post, report:

With a few exceptions, the average body mass index in most countries has risen since 1980, according to a project that tracked risk factors for heart disease and stroke in 199 countries over 28 years.

Each circle represents a country, plotted by men's BMI on the horizontal axis and women's BMI on the vertical. Countries above the diagonal are countries where women have a higher BMI than the men, and vice versa for dots below the diagonal. Press play, and watch how BMI has changed from 1980 to 2008.

While all the countries are moving up and to the right, the Oceanic countries appear to have made the biggest moves over the past few decades, with several countries venturing into the obese BMI range.

Some European countries were actually making a move towards normal weight during the 1990s. Lays got the best of them though, and they could no longer eat just one. Damn you, Lays. I never win that bet.

[Washington Post via @hfairfield]

--
Learn data. Pre-order the FlowingData book.