The bedroom is a private place, and what goes on in the bedroom usually stays in the bedroom. However, the Sexperience 1000 (by Mint Digital and Lingobee), using data from the "Great Britain Sex Survey," provides a statistical picture of what people do or have done.
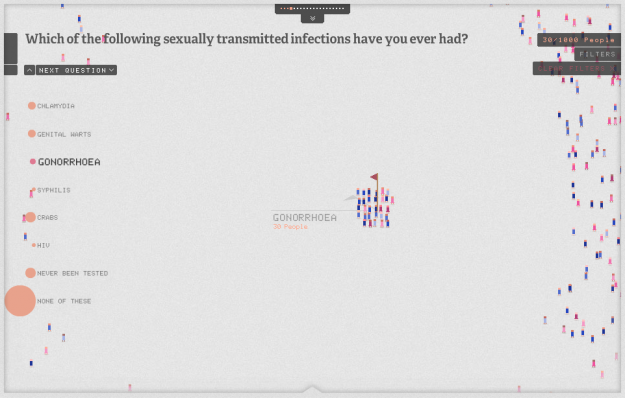
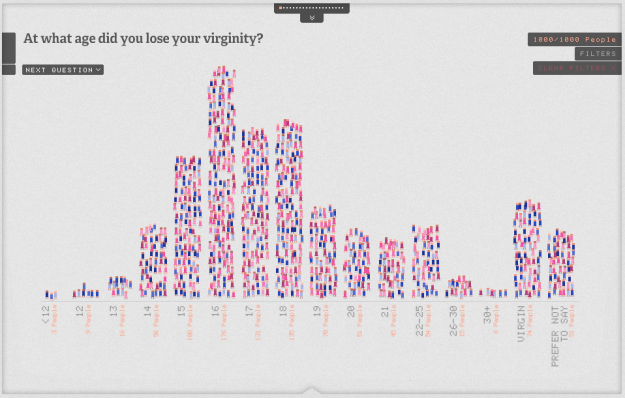
The collection of small icons represents a sample of 1,000 people, and each icon represents an individual. They're color-coded by age and gender. Mouse over to see the age and the area they're from. From there, you can scroll through each question, such as, "At what age did you lose your virginity?" and the icons move around to their proper category.
Because the individual that each icon represents stays consistent throughout, you can loosely follow individuals as you flip through questions and categories. For example, people were asked what sexually transmitted diseases they've had. Select different diseases — Chlamydia, Gonorrhoea, etc — and there are a few people who seem to have been exposed to a lot of things.

Then there's the filters on the right that let you zoom in on the demographic you're interested in. Again, the icons sort themselves in a way that is useful.
One caveat: The sample of 1,000 people is supposed to be a demographic representative of the UK population, however, that sample itself is taken from another sample of 7,500 people who watch The Sex Education Show. So the answers to some of the questions are probably skewed. Plus, people often lie about sex. Still though, it's worth a look.
[The Sexperience 1000 | Thanks, Andy]
