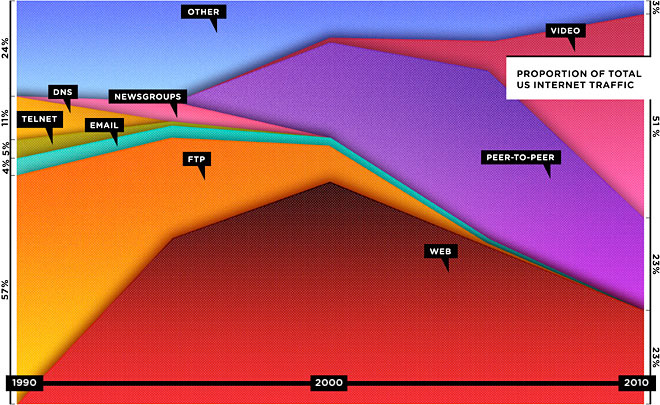
 Their feature, The Web is Dead. Long Live the Internet, is live at Wired's own website.
Without commenting on the article's argument, I nonetheless found this graph immediately suspect, because it doesn't account for the increase in internet traffic over the same period. The use of proportion of the total as the vertical axis instead of the actual total is a interesting editorial choice.
Their feature, The Web is Dead. Long Live the Internet, is live at Wired's own website.
Without commenting on the article's argument, I nonetheless found this graph immediately suspect, because it doesn't account for the increase in internet traffic over the same period. The use of proportion of the total as the vertical axis instead of the actual total is a interesting editorial choice.You can probably guess that total use increases so rapidly that the web is not declining at all. Perhaps you have something like this in mind:

In fact, between 1995 and 2006, the total amount of web traffic went from about 10 terabytes a month to 1,000,000 terabytes (or 1 exabyte). According to Cisco, the same source Wired used for its projections, total internet traffic rose then from about 1 exabyte to 7 exabytes between 2005 and 2010.
So with actual total traffic as the vertical axis, the graph would look more like this.

Clearly on its last legs!
Assuming that this crudely renormalized graph is at all accurate, it doesn't even seem to be the case that the web's ongoing growth has slowed. It's rather been joined by even more explosive growth in file-sharing and video, which is often embedded in the web in any case.
Update: It's also worth adding that bandwidth, though an interesting measure of the internet's growth, isn't so good for measuring consumption. It doesn't map to time spent, work done, money invested, wealth yielded... Does 50MB of YouTube kitteh represent more meaningful growth than a 5MB Wired feature? And, as others point out in the comments, many of the new trends are still reliant on the web to work, especially social networking.
